
 Piotr Buczkowski
Why we are building our own crowd engine
A classic evacuation study ends as a floor plot and a table of times. It answers where people get stuck. It does not show what that looks like in a particular building, through its cameras, for the people who have to decide what to change.
We started with one-off simulations: a concert field, this garage, a series of panic cases. Every new venue meant new work, and two scenarios built by hand could quietly follow slightly different rules. So we pulled everything into one engine. A scenario goes in, a result comes out, and the same result can be shown on a floor plan, in 3D or on a scan of a real building.
- One scenario file describes the floor, where people are, how fast they walk and when they start, the exits, and events on a timeline: smoke closing an exit, a gate shutting, a surge towards a stage, a sudden threat.
- Two motion models. Walking to exits and a crowd pushing in panic are different physics. The evacuation model passes 10 of the 12 verification tests in IMO MSC.1/Circ.1533, the International Maritime Organization's test suite for evacuation software. The panic model tracks pressure between bodies and falls, and passes the counterflow test that the evacuation model fails.
- One result format. Positions every tenth of a second and counts per exit. The same file becomes a top view, a chart and an animated crowd in Unreal Engine.
The garage
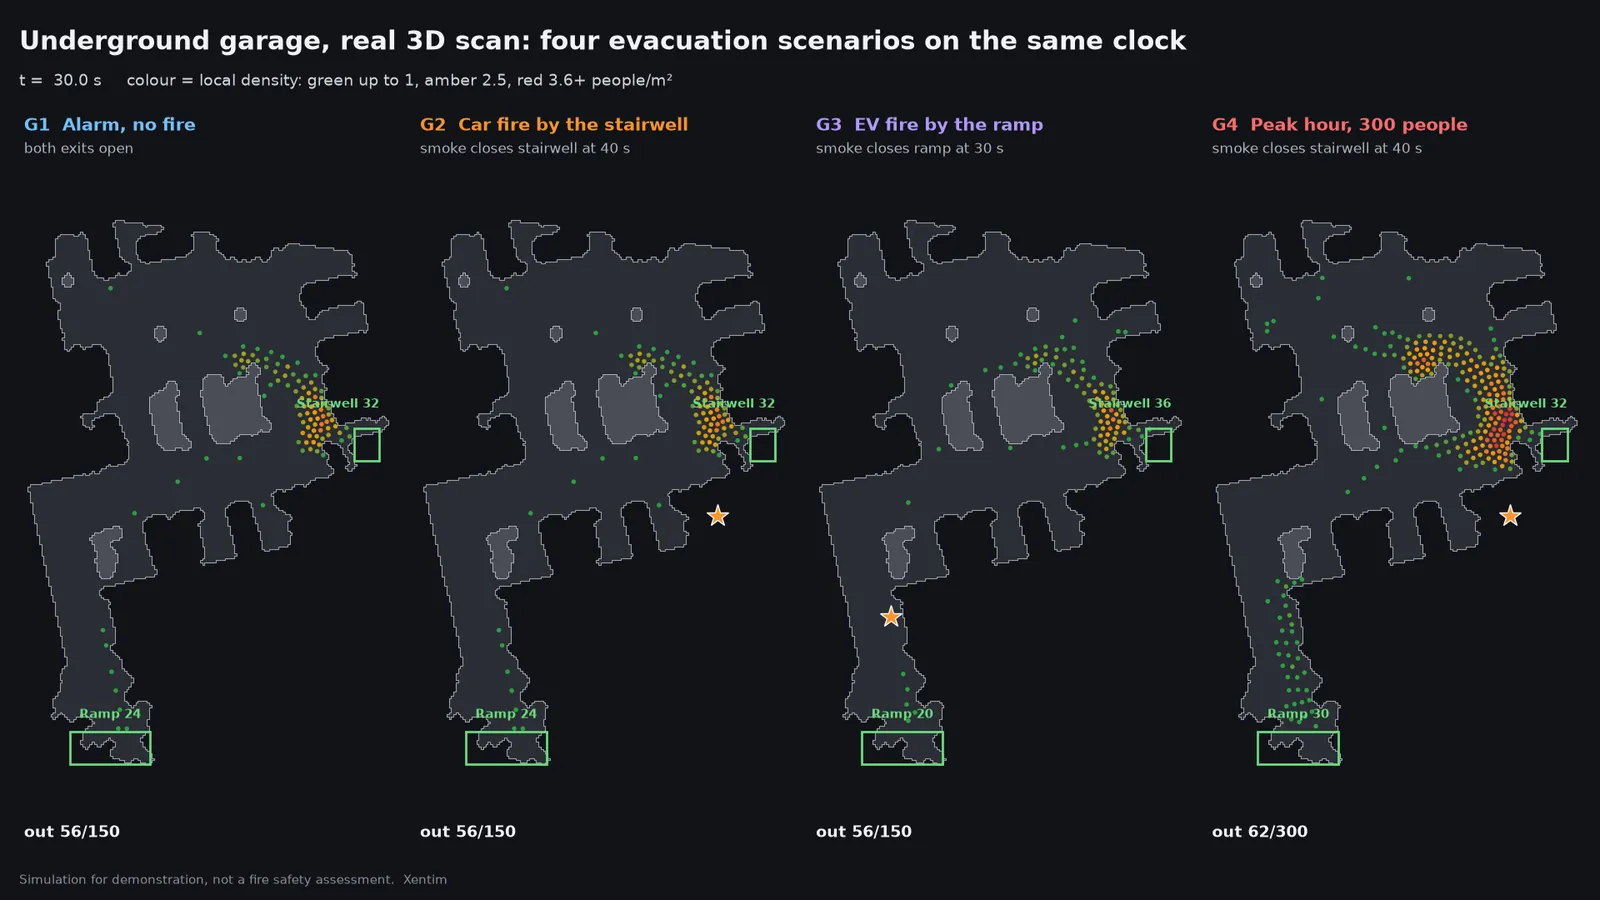
The garage is a real underground car park, scanned with a handheld 3D scanner. From the scan we took the floor people can walk on (596 m² between cars, pillars and walls), the two exits (a stairwell and the vehicle ramp) and the positions of six CCTV cameras, with the direction each one looks. Every scenario below uses the evacuation model, the one checked against the IMO tests.
Four scenarios
| Scenario | People | What happens | 90% out | Last person out | Stairwell / ramp |
|---|---|---|---|---|---|
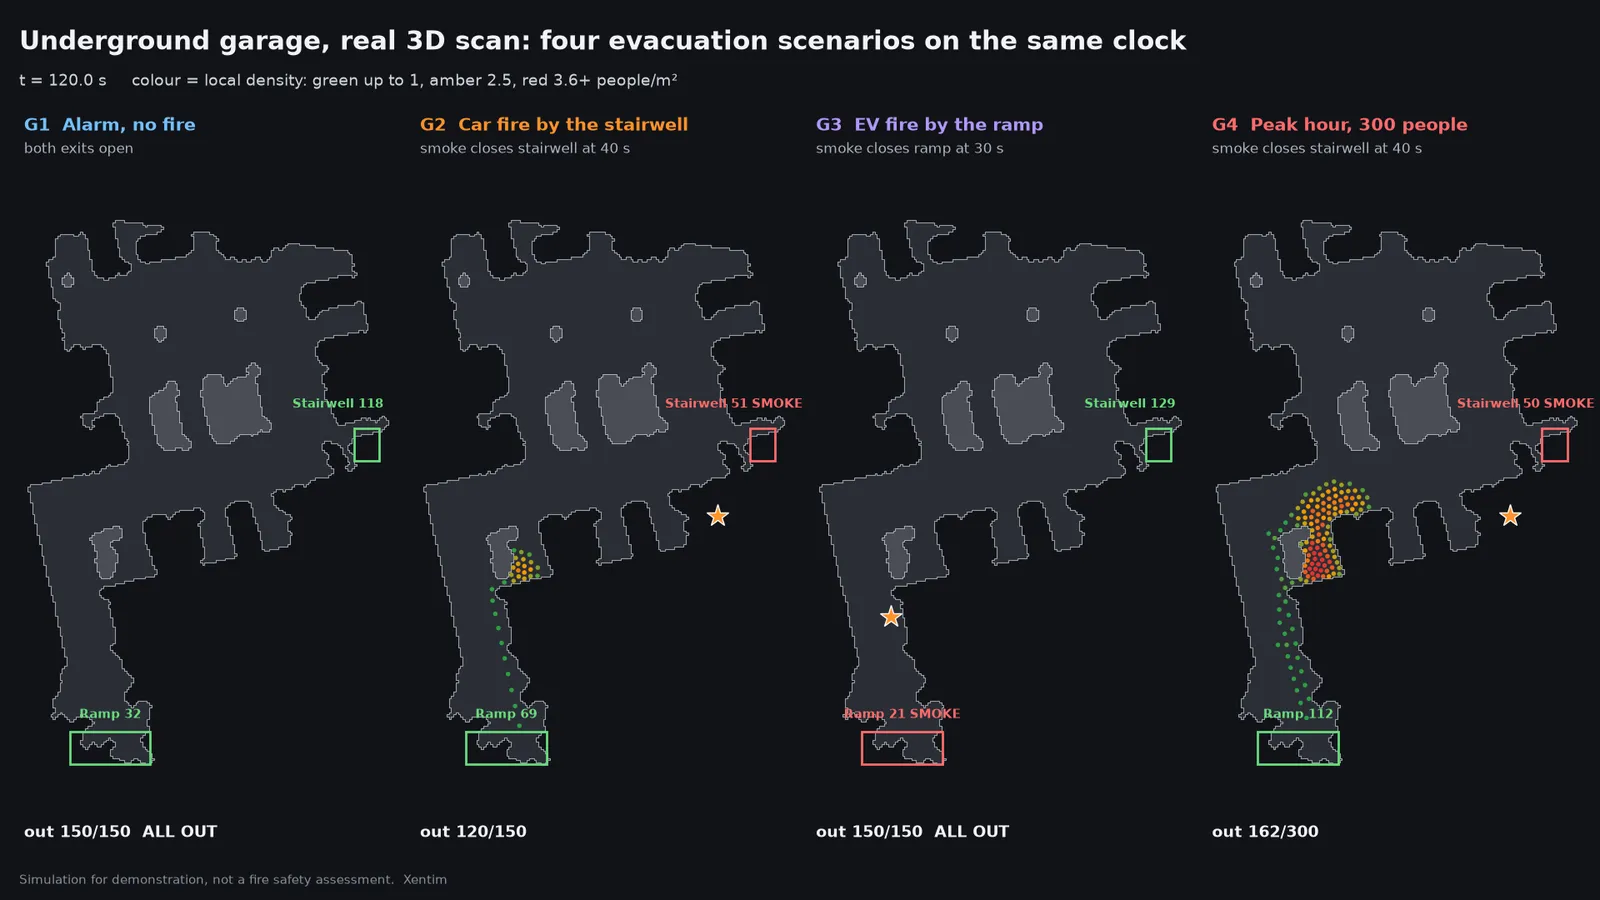
| G1 Alarm, no fire | 150 | both exits stay open | 71 s | 80 s | 118 / 32 |
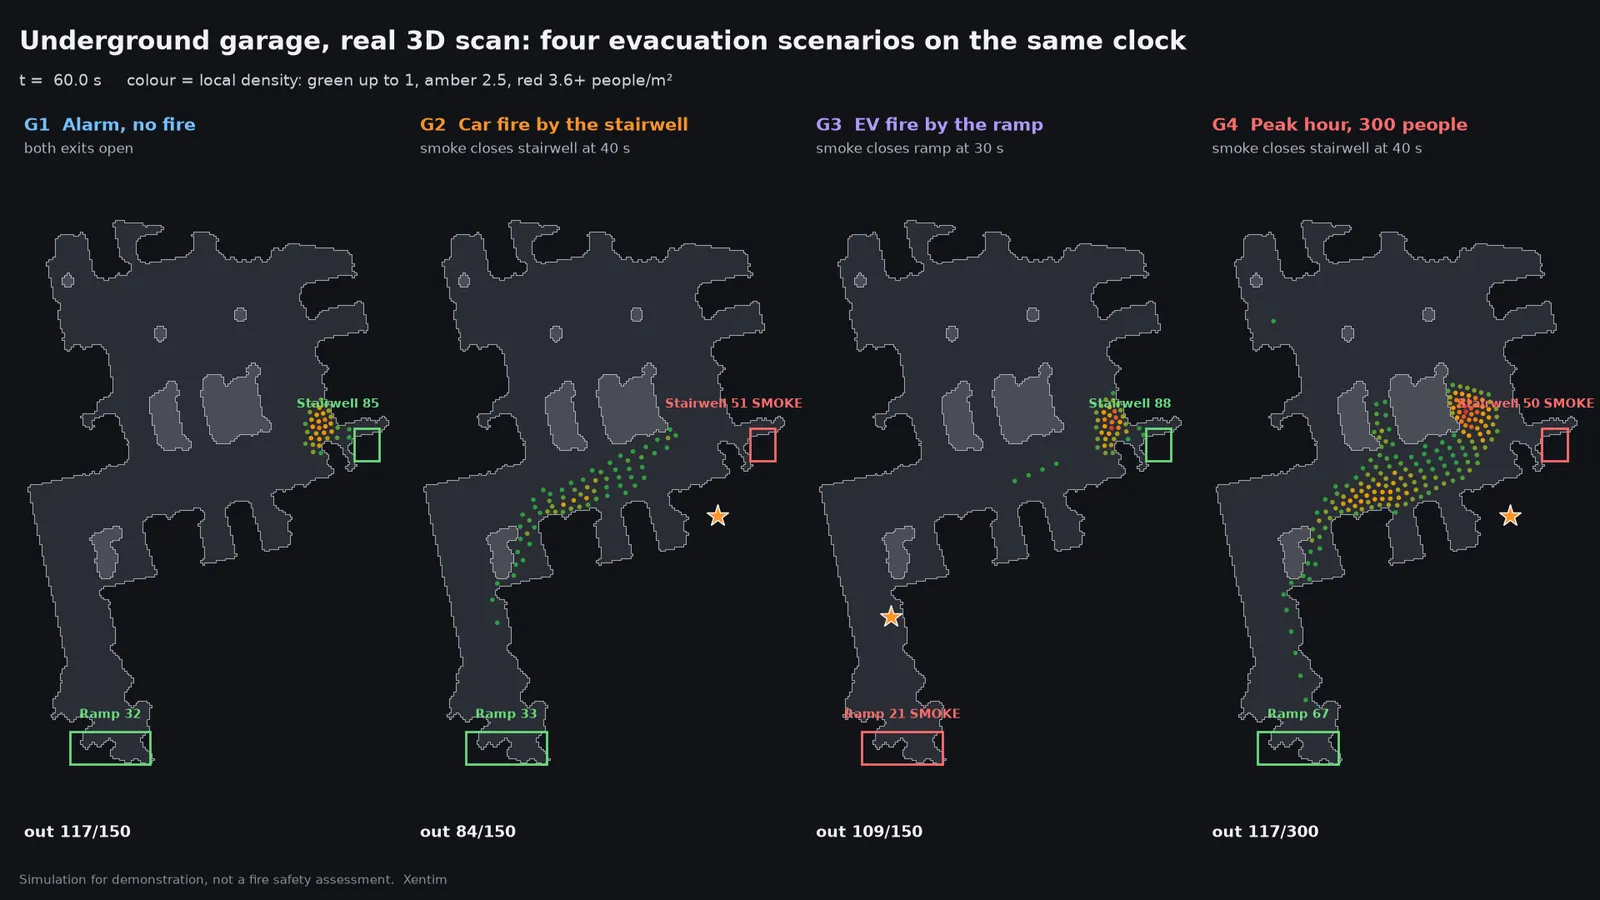
| G2 Car fire by the stairwell | 150 | smoke closes the stairwell at 40 s | 141 s | 171 s | 51 / 99 |
| G3 Electric car fire by the ramp | 150 | smoke closes the ramp at 30 s | 74 s | 83 s | 129 / 21 |
| G4 Peak hour | 300 | smoke closes the stairwell at 40 s | 221 s | 267 s | 50 / 250 |
What the numbers say
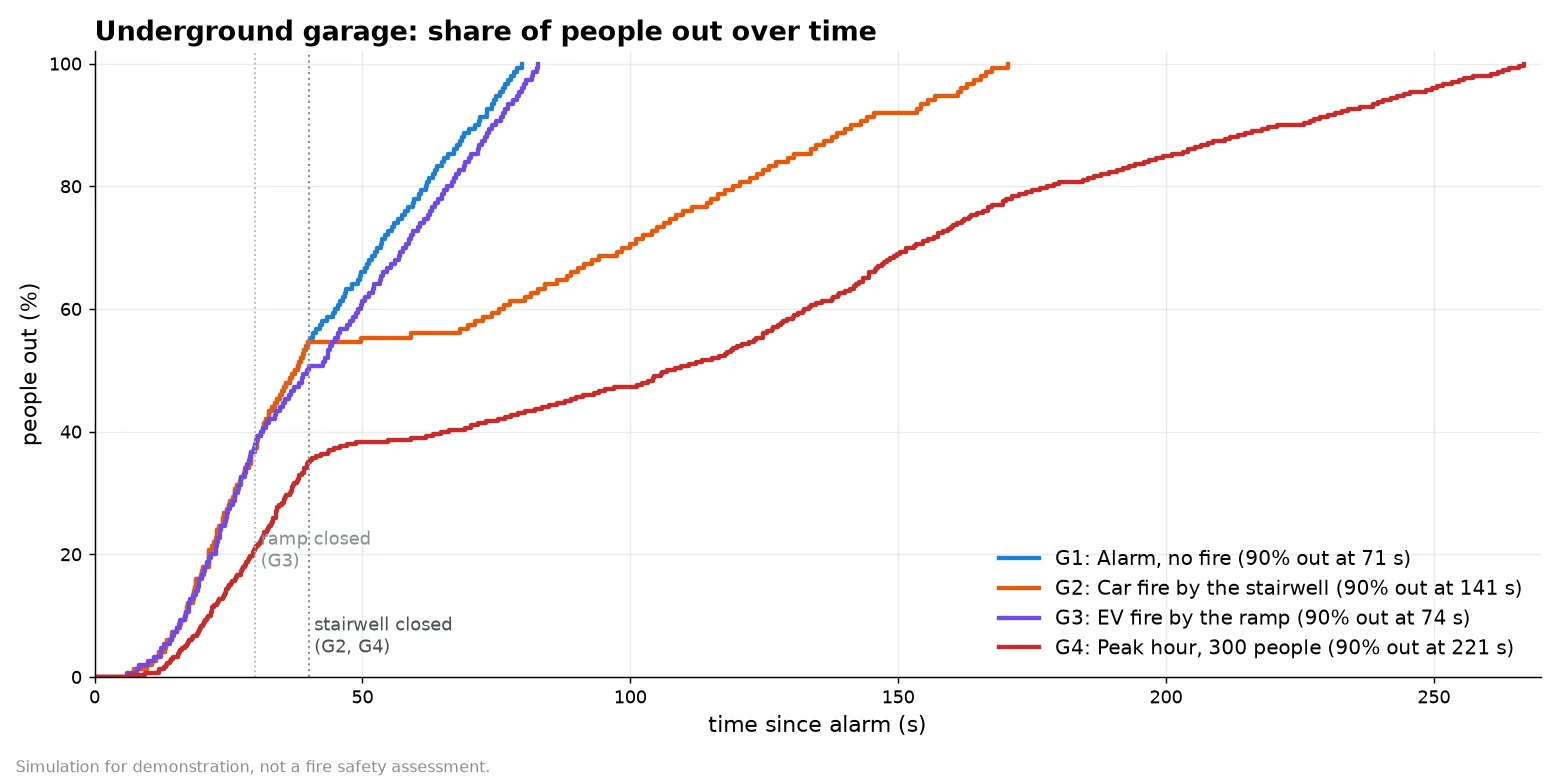
The stairwell carries this garage. With both exits open, 118 of 150 people leave by the stairs. When smoke closes them, the time until 90% are out doubles, from 71 to 141 seconds.
Losing the ramp barely matters. When the electric car by the ramp fills it with smoke, most people were heading for the stairs anyway. The time to 90% grows by three seconds. A fire safety plan that treats both exits as equal misses this difference.
Half a minute with nobody getting out. In G2 the curve goes flat after the stairwell closes. The people who were queueing there walk back across the garage, and for almost 30 seconds nobody reaches an exit.
At peak hour the queue moves inside. With 300 people the jam does not form at the ramp. It forms where the aisle narrows beside a pillar on the way to the ramp, with up to 5.4 people per square metre. That is a spot a camera should watch and a place where a parked car or a pallet would make things worse.
These results compare variants of one building. They are not a fire safety assessment, they do not model smoke physics (smoke here only closes an exit) and they do not replace the fire engineer's report. Every video and chart says so.
The same engine on a festival field
The panic model handles what a garage evacuation does not: a crowd pushing. On a concert field with 2,640 people, a surge towards the stage left 11% of the people in the front area on the ground. Splitting the front area into pens with a second barrier line cut that to 6.5% in the same surge. These numbers are for comparing two layouts, not for predicting injuries.
What comes next
Next is a panel inside Unreal Engine: drag crowd zones, exits, barriers and fires onto a scan, press Simulate, keep each run as a version and play two versions side by side. After that, different kinds of people (children, older people, wheelchair users), groups that stay together, and several runs per variant so the answer is a range instead of one number.
For a garage manager the useful question is simple: which exit really carries your building, and what happens when that one is gone? Which one would it be in yours?
Questions and answers
Is a crowd simulation a fire safety assessment?
No. It shows how people move in a given layout and lets you compare variants: an exit closed, more people, a different fire location. The formal assessment stays with a fire safety engineer. Our videos and reports carry the note “simulation for demonstration, not a safety assessment”.
What do you need from the site?
A 3D scan of the building or a floor plan with exits. With a scan we also place virtual cameras where the real CCTV cameras hang, so each scenario can be watched through them.
How was the crowd model checked?
The evacuation model passes 10 of the 12 verification tests in IMO MSC.1/Circ.1533. It fails the two tests with a very dense crowd at a narrow door, where it locks up. For crowds pushing against each other we use a separate panic model, which passes the counterflow test.
How long does one scenario take to compute?
In this garage, 150 people take 25 to 60 seconds and 300 people about three and a half minutes. A 2,600 person panic scenario on a festival field takes about four minutes.
All numbers come from our own simulation runs on 17 November 2026. The garage is shown with the owner's permission; licence plates are masked. Sources: IMO MSC.1/Circ.1533, Revised guidelines on evacuation analysis for new and existing passenger ships. Helbing D., Farkas I., Vicsek T., Simulating dynamical features of escape panic, Nature 407, 2000.